
All about the Elo Rating System
Explore the Elo Rating System which determines your FIDE Rating
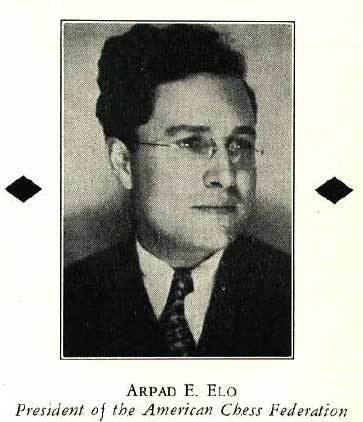
**Table of Contents> > > > History of Elo> > > > What is Elo?> > > > Elo Features> > > > Elo Formulas> > > > Development Curves> > > > Rating Inflation> > > > Rating Deflation> > > > Current Developments> > > > ## **History of Elo> > > > "Simply stated, the Elo Rating System is a numerical system in which differences in rating may be converted into scoring or winning probabilities. And conversely, scoring percentages can be converted into rating differences. It is a scientific approach to the evaluation of chess performances."> > > > Arpad Elo, The Rating of Chessplayers, Past and Present, Second Edition, 1986, (p.4)> > > > The Elo Rating System was invented by Arpad Elo. Elo is used to assess the difference in chess strength between players. It helps to award titles by setting a rating to be achieved. Becoming GM requires achieving an Elo of 2,500 for example. Elo helps to avoid pairings between the strongest players at the beginning of a Swiss Tournament (players with equal/as close as possible points in the tournament play each other). Elo also helps to calculate tiebreaks.
The Elo Rating System is not just used in chess, but also in other games. The shared feature is the ranking of players. Elo is used in Go and Scrabble. It is used in tennis for The Universal Tennis Rating. A modified version is used in the Esports game Overwatch.
Arpad Elo was born in 1903. He won the Wisconsin Chess State Championship a total of eight times. He was the President of the American Chess Federation in 1935-1936. Arpad Elo was the chairman of the rating committee formed by the United States Chess Federation (USCF) President Jerry Spann in 1959. The committee was formed to look at reviewing their rating system (Harkness System was the rating system used by the USCF at the time). Dr. Eric Marchand (mathematician) and Guthrie McClain (statistician) were also part of the committee and provided constructive criticism.
Elo used measurement theory to create the system. Other ratings systems existed previously in the past which were used by different national chess federations. There used to be no international rating system. Mr. Elo changed this. Fred Cramer was the President of the U.S. Federation in the 60's as well as a FIDE delegate and helped to integrate the Elo Rating System into FIDE officially. FIDE adopted the Elo system as its official rating system in 1970. James Warren was a committee member who developed a computer program to calculate FIDE ratings. Warren McClintock was the successor to Elo as Chairman of the rating committee. He surveyed the rating system to verify it's efficacy.
 *alchetron.com/Arpad-Elo> > > > ## **What is Elo?> > > > Elo is a way of measuring player strength using numbers. If a player A has a higher Elo than Player B, then Player A is better than Player B. It is measured by first taking into account a players performance against an opponent group as a first approximation. Then losing and winning games will decrease or increase the rating respectively. The higher the rating difference, the more points that will be won or lost. Chess performances above the current Elo will increase the Elo rating.
Elo uses an interval scale. This means equal differences between any two players represent the same difference, but there is no fixed 0 point.
**Elo Features> > > > Higher Elo = Better player than those with lower Elo. Elo is a relative measure. If everyone got 1 million free Elo points, the system would still work.
Of course for practical reasons this is not wanted. Because then everyone would be a Grandmaster. So you want it stable.
Elo predicts performance. If two players have a 100 point difference, then Elo predicts that the higher rated player will have a 64% percent score, over an infinite match. This prediction is constant between levels, as long as the relative difference is equal. (A 2,100 has a expected 64% percent score over a 2,000 Elo player, A 1,100 also has a expected 64% percent score against 1,000 Elo player).
A percent score means the percentage of expected points (e.g. having a 100 point higher rating than your opponent = 64% percent score. This means you'd score 64 points in a 100 game match with them).
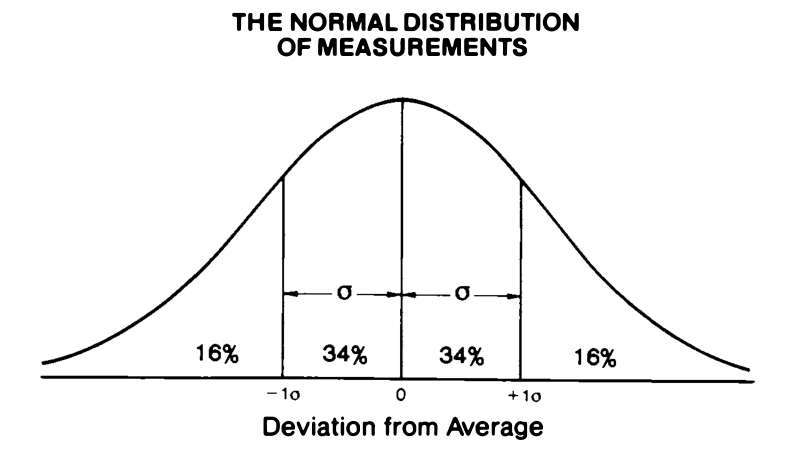
The Elo System assumes 50% of chess performances will be below your rating and 50% will be above your rating. This models how performances always vary around a point, sometimes people have worse days or they have better days. But the performances hang around a certain level. Performance is assumed to be modeled by a normal distribution (shown below). The normal distribution is a way of being able to model the exact way in which the performances vary. It tells the probability of a certain performance assuming there is a fixed average point around which the performances fluctuate. It simply represents the fact that random fluctuations center around a certain point. Extreme fluctuations have a much lower probability of occurring, compared to fluctuations closer to the average point. Just like how playing way worse or way better than your rating is more rare compared to performing at your rating. If you start having more better performances than worse performances, then your Elo will increase. This shows how Elo is a self-correcting system.
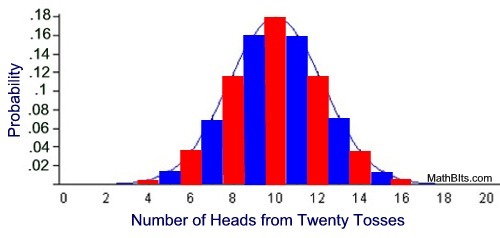
The normal distribution is based on a fancy equation which turns a binomial distribution into a continuous sequence. A binomial distribution is simple: it models coin flips. If you flip a coin 10 times in a row, all tails or all heads is very rare. It's more likely to be a mix. This creates a graph of probabilities which goes up in steps. Math people used fancy math to convert the step graph into a smooth graph version. And the smooth graph is the normal distribution (shown behind the binomial distribution in the image below).
The normal distribution is used because people saw that it fits the curve formed by the probabilities of various physical phenomena which center around a fixed points (heights, weights, birthweight, ACT scores, visual acuity, blood pressure, bird wingspan, raindrop diameter etc). The normal distribution is everywhere. It also fits because deviations from the average value happen randomly in either direction. The normal distribution was found to model chess performance very closely when it was compared to real chess performances, which gave support to the assumptions of the Elo Rating System.
 *On the left is terrible chess, On the right is amazing chess. It is most common to have performances around your given rating (the peak of the curve). The Standard Deviation of a performance was taken to be 200 points, 200 points was considered to be a class interval traditionally (e.g. Class A is 1800-2000). 2000 was taken as the upper level for amateurs.> > > > Arpad Elo, The Rating of Chessplayers, Past and Present, Second Edition, 1986. (p.8)
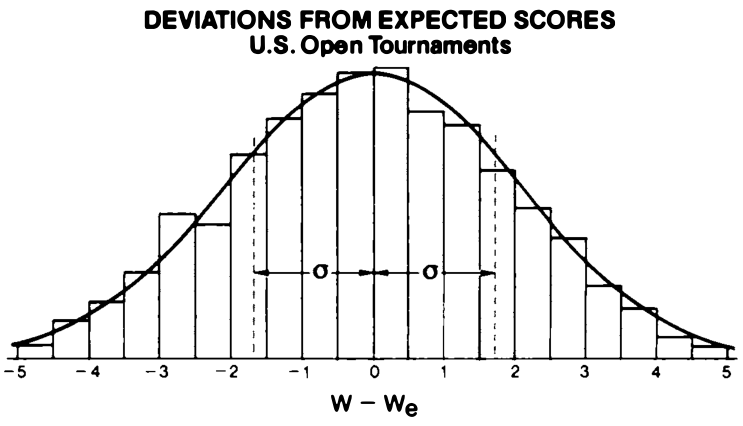 *Comparing deviations from expected scores from 1,514 participants in the 1973-75 U.S. Opens. Note how the normal distribution approximates the real performances very closely.> > > > Arpad Elo, The Rating of Chessplayers, Past and Present, Second Edition, 1986. (p.34)
**Elo Formulas> > > > The are multiple Elo formulas. The formula below shows how the ratings are updated. After someone finishes a tournament, the expected score overall based on the opposition is subtracted from the players actual score in the tournament. This number is multiplied by a K factor and then added to the players rating to get their new rating. The K factor is a multiplier which amplifies the points.> > > > The K Factor: How much we amplify the rating loss/gain, new players have high K factor so that we can converge on their true rating more quickly.> > > > If less than 30 games played total then K=40, (when 30 games total is fulfilled in the middle of an event, K=40 stays until the end of the event), (highest rating fluctuation)> > > > If under 18 and rating under 2300 then K=40> > > > If rating is under 2400 and not in above categories then K=20> > > > If rating is over 2400 then K=10 from then on (lowest rating fluctuation)> > > > If the K factor * number of games played over 1 month between published rating lists is over 700, then the K factor = 700/number of games. This is so that rating gains don't become overly large if a player has a series of good tournaments.> > > >  *New Rating = Old Rating + K Factor * (Actual Score-Expected Score)> > > > #### An example calculation is shown below for a 1500 Elo player who has played over 30 games total and is over 18. Since they are under 2400, their K factor is 20.
This calculation is for a tournament where they were expected to score 5 points (expected score calculated by summing the expected score for each opponent in the tournament, formula shown below), but actually scored 7. So they played better than expected leading to a rating gain of 40 points:> > > > R = 1500 + 20(7-5)> > > > R = 1500 + 40> > > > R = 1540> > > > ### **How to find the expected percentage score for Player A vs Player B: This formula gives the expected percent of points scored in a match:> > > >  *Expected Percentage Score Formula> > > > If we input 2,100 for Player A and 2,000 for Player B in this formula then we get 0.64 as the answer. This means that the expected score in a 100 game match for Player A would be 64. This number includes possible draws and wins.
The fact that Player A has a higher score is expected since they have a higher rating. The (B-A) expression simply tells the difference in rating. This is another way of showing that Elo assumes that equal rating differences have equal probabilities, whether the players are GMs or beginners doesn't matter.
The expected score in a tournament is calculated by summing the expected percentage points against their opponents. For example, a 2100 Elo player playing against a 2400, 2000, 1900 would have expected scores of 0.15, 0.64 and 0.76 respectively. So the expected score would be 0.15+0.64+0.76 out of 3 which gives an expected score of 1.55/3. This is how the expected score is calculated for the new rating formula New Rating = Old Rating + K Factor * (Actual Score-Expected Score).> > > > Fun Fact:* Albyn Jones & Mark Glickman, inventor of the Glicko Rating System found that the formula is more accurate when '400' is changed to '561'.
**How to find initial ratings for new players:> > > > A initial rating for a new player is calculated by taking the average rating of their opponents and then adding the rating difference based on the percent score. If you see below, there is a graph showing rating difference and the percentage of winning (C=200). To find the rating to be added or subtracted then we go to the percentage scored against their opponents. There is a look up table with the values which the rating difference based on the percentage scored, this graph just shows how it works graphically.
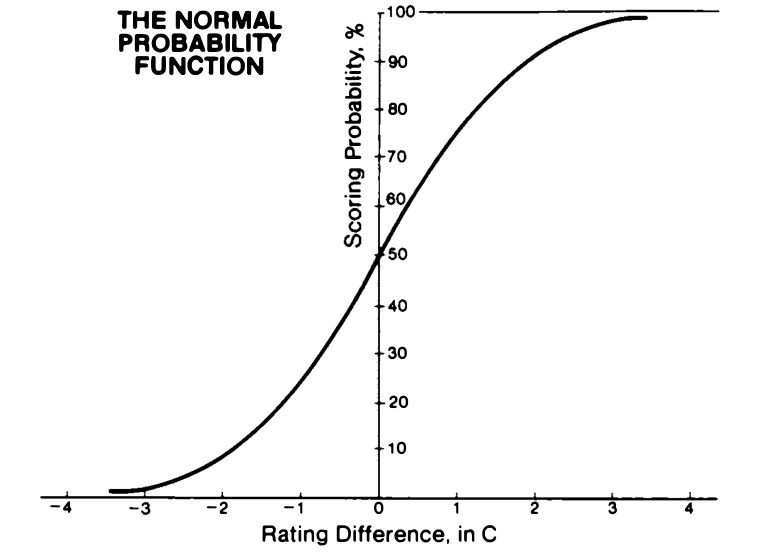 *1C (200 points) gives a expected percent score of 76%.> > > > Arpad Elo, The Rating of Chessplayers, Past and Present, Second Edition, 1986. (p.10)
This graph shows winning probabilities by rating difference (C=200 points, C is the standard deviation). 50% = 0 because then you are at the same level as the opponent. Having a 100 point advantage means a expected percentage score of 64%, 200 point advantage means a expected percentage score of 76%.
 *Initial Rating Formula> > > > If a new player's opponents are on average 1600 Elo and they score 76% overall, then their initial rating is 1600 + 200 = 1,800. We get the '200' from a look up table (the rating different graph shows it graphically), a 76% performance is considered to indicate a difference of 200 Elo based on the normal distribution. 50% performance would be a 0 rating difference because this would be mean that someone is winning 50% of the time against a certain level, indicating they are at that level.
At least 5 games have to be played to get an initial rating and the score should be above zero. The minimum possible initial rating is 1400 and the maximum 2200. Two imaginary 1800 Elo opponents are also included in the average opponent rating. This is to bump up the initial rating to combat rating deflation (described in the rating deflation section). Also the results of the games against the two imaginary players are considered to be draws. If a player falls below 1400 Elo then they are considered unrated and the process starts again for an initial rating.
**Development Curves> > > > The rating system allows a player's strength over their career to be calculated. After averaging, this showed a common pattern of a rating curve rising to its peak, before gradually declining linearly. This shows how strength changes over a players career. Elo found that chess strength at 21 and 63 years old were equal. This was for top master players in the past. Also those with longer longevity also had a longer period of peak performance, the top of the curve was longer, meaning more time spent at their highest chess level. This curve might not look the same today. The graph below is based on the pre-computer era. The curve might be steeper at the beginning due to computers allowing greater chess improvement.
 *Arpad Elo, The Rating of Chessplayers, Past and Present, Second Edition, 1986. Mark Glickman & Albyn Jones, Rating the Chess Rating System, (1999).> > > > ## **Rating Inflation> > > > Rating inflation means that a increase in rating is not due to a increase in strength. Rating deflation means that a decrease in rating is not due to a decrease in strength. It is the idea that a rating in the present is not worth the same rating in the past in terms of strength.> > > > Rating inflation/deflation is a debated topic.
Players ratings were stable from the start of the Elo system in 1970. From around 1985 onwards, ratings started increasing leading to speculation of rating inflation occurring.
| Ken Regan's analysis showed that chess strength of similar ranked Elo remained the same over the 1976-2009 years, via computer analysis. This means that rating inflation is not occurring, chess players are simply getting stronger. As the table shows, the skill levels remain similar over the years (Lower the number the more skill).> > > > "Since a lower s indicates higher skill, we conclude that there has been little or no ‘inflation’ in ratings over time—if anything there has been deflation. This runs counter to conventional wisdom, but is predicted by population models on which rating systems have been based."> > > > Ken Regan & Guy Haworth, Intrinsic Chess Ratings, 2011> > > > | 1976-1979 | 1991-1994 | 2006-2009 | |
|---|---|---|---|---|
| 2700 | - | .079 | .078 | |
| 2600 | .094 | .092 | .092 | |
| 2500 | .094 | .098 | .092 | |
| 2400 | .099 | .101 | .098 | |
| 2300 | .121 | .116 | .108 |
This means that the reason that Elo has been increasing is because people got better at chess. The question is why skill was stable from 1970-1985 and then started increasing. A major event in the mid 80's-early 90's were the Kasparov-Karpov World Championship Matches. The 1984 match had 48 games, 1985: 24, 1986:24, 1987:24, 1990:24. They played 4 consecutive matches in 4 years. That's a lot of games. More games from the very top players, may have led to an improvement in chess understanding. Fischer quit chess and the lack of rivalry with Karpov meant that maybe improvement in chess understanding stagnated in the 70's resulting in a flat rating line.
It could also be due to the Missing Soviet generation effect. In WW2 around 25 million Soviets were killed. This meant that the generation born in the 1920s would have been massacred, resulting in less people being born afterwards. In the 1960s the Soviets players were getting older and the new generation that was supposed to come afterwards was reduced in number due to the WW2 deaths, resulting in reduced population numbers for the next generation of chess players. Less numbers of the next generation = less chess improvement due to less high level competition. In the 70's, Karpov only had Korchnoi as a close contender, while later on especially in the 90's the number of high level contenders increased (Anand, Ivanchuk, Karpov, Kasparov).
Rating Deflation
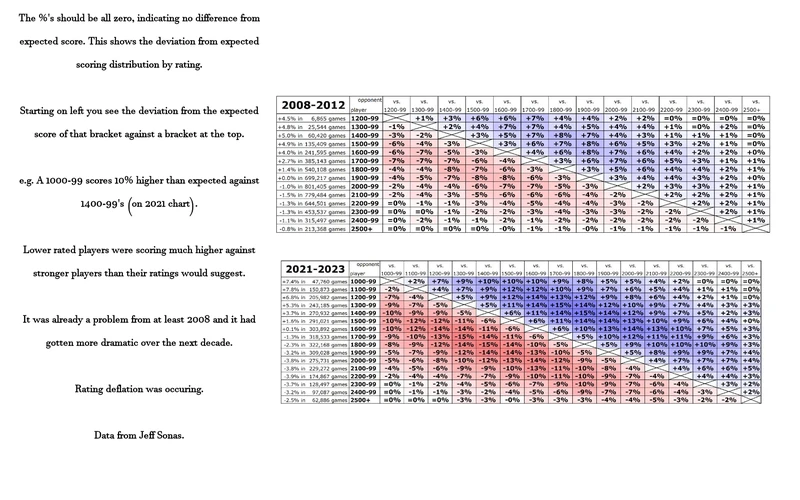
The Elo rating system was found to be not predicting some game outcomes accurately. Lower rated players were scoring more wins against higher rated players than expected. This meant that lower players (<2000) were being underrated by the system. In 2023, Jeff Sonas (inventor of Chessmetrics) proposed compressing up the Elo of players under 2000 (1000 Elo became 1400 Elo etc). By raising their ratings, they would no longer be underrated. This would stop the problem of lower rated players beating higher rated players more often than predicted by their rating. Jeff Sonas also proposed adding two imaginary draws against two imaginary 1800 opponents as part of the average opponent rating when determining initial ratings. This would lift up the initial rating. These measures would hopefully halt the rating deflation that was occurring.
The formula for finding a new rating was adding to the current rating a total of: (2,000 – current rating) * 0.4.
e.g. For a 1600 player we have: (2000-1600)*0.4 = 400*0.4 = 160. So we add 160 to 1600 to get a new rating of 1760. A 1600 player became a 1760 Elo player in 2024 after FIDE implemented the rating change.
The were three factors that caused rating deflation
1. Elo doesn't take into account variability
The first reason this occurred is because Elo doesn't take into account variability. New players have a greater variability as their rating is not established yet compared to more experienced players. A player who hasn't played in a long time also has greater variability compared to a established player who plays continually even though they may have the same rating. Mark Glickman (of Glicko fame) and Albyn Jones found in 1999 that Elo ratings underestimated the winning probabilities of lower rated players.
Here's an example from their paper which shows how the effect can occur: Imagine calculating the expected percentage score of a 1900 player vs 1700 player. This gives a 76% expected percentage score. This would be the case if the variability was the same. But imagine that half of 1700 players were actually 1600 and the other half were actually 1800 (a way of adding variability). This would give two expectancy scores for the 1900 player: 64% against the 1800 Elo and 85% against the 1600 Elo. The average would be 74.5% which is less than the 76% assuming no variability. This is a hypothetical example to demonstrate how variability can underestimate lower rated players' performance against higher rated players. This also forms the basis of the Glicko system which has a rating deviation score (Glicko-2 is used on Lichess). Rating gains are calculated based on both players' RD's, higher RD equals more variability and higher point loss/gains. Rating volatility is another metric added for Glicko-2, taking into account expected rating fluctuation. Glicko is more accurate than Elo, but Elo is simpler to calculate (people can calculate requirements to reach norms for titles more easily).
2. Lower rated players are underrated
The second reason this occurred was because lower rated players were being underrated. The emergence of computers and chess engines exacerbated an already existing underrating tendency as described above. Computers allowed lower rated players to learn faster. This meant that the rating system was underrating them, resulting in lower rated players beating higher rated players at a greater rate than expected. The reason they were underrated is because the rating floor was lower at 1,000 Elo and the K factor being lower which couldn't keep up with the increased rate of chess development as a result of computers. Another reason for lower rated players being underrated is the monetary costs for submitting FIDE tournaments which causes less rating updates on players in national federations with less money.
3. The amount of lower rated players increased over time
The third reason is that the pool (amount) of lower rated players increased over time. The minimum rating was originally 2200 at the start of the Elo System, a high number. Elo was international so this was considered normal. Lower rated players could get a national rating based on the system of their federation. In 1993 the minimum got lowered to 2000, which meant there were more lower rated players in the pool. In 2001, it changed to 1800 and over the next decade got lowered multiple times until it reached 1000 Elo in 2012. This meant a dramatic increase in the number of lower rated players over time. Since lower rated players were underrated as mentioned above, this meant that the effects were increased. The rating deflation occurred more rapidly as there were more lower rated players eating up the high rated players' rating in a disproportionate amount. Also lower rated players tend to be younger, and younger people play more which also causes even more rating deflation. National federations with higher proportions of junior players also cause higher rates of rating deflation compared to federations with lower proportions of junior players. This means that a rating of a player in one federation might not be equal to a rating of a player in another federation. Lower rated players were scoring more wins against higher rated players than expected, and the increase of the rating pool due to the lowered minimum rating increased the rating deflation.> > > > "Deflation becomes more acute with a greater percentage of new and improving players in the pool and with their entry into rated competition earlier in their careers. The junior players, who can improve dramatically even between two tournaments, are principally responsible for the deflation generally found in national applications of the rating system."> > > > Arpad Elo, The Rating of Chessplayers, Past and Present, Second Edition, 1986, (p.48)> > > > In 2014, FIDE saw the problem and did raise the K factors overall and keep higher K factors for lower rated junior players over more games to try to fix the problem but the changes weren't effective and the rating deflation kept occurring.
So in March 2024, as part of Jeff Sonas' proposal, FIDE performed the upward compression on sub-2000 players, raising the floor to 1,400 Elo and also changed the initial rating calculations to hopefully fix the rating system.
Are the measures working?
This analysis by Vlad Ghita (Vlad_G92) says no: FIDE Ratings Revisited
**Current Developments> > > > ### FIDE will be implementing rating decay. What will it look like?
Rating Decay is when someone's Elo reduces due to inactivity. If someone plays no games within a year, then they are listed as 'inactive' and they will not show up on the FIDE rating list.
This means that someone could play one game a year and keep themselves on the rating list with a barely changed rating. At the top level this is a problem as it is not fair to those who play continually. Someone who plays infrequently can sit on their rating without risking any points. This means that the rating is a less accurate reflection of their true strength.
Quite a few of the top players have decreased their playing amount substantially.
At the beginning of October 2025, FIDE sent a questionnaire to 150 top players asking for feedback on the idea of rating decay.> > > > Do you think the ratings for top players shall decay?> > > > Shall there be a rating decay, what should be a minimum of classical rated games per year?> > > > What shall be a minimal average opposition for that player to count towards the total (no minimum/his own Elo minus 200/minus 400).> > > > Shall this minimum not be reached, would you find it fair to deduct rating points (if yes, how many)?> > > > Or maybe use a higher K-factor, but only for their negative results?> > > > To remind everyone: today it is enough to play one rated game per year in order not to be considered inactive. And even if you are inactive, and then resume playing, you get back with the same rating. Do you feel it should be kept like that?> > > > Emil Sutovsky (FIDE CEO) Tweet, October 3rd, 2025> > > > FIDE also did some housecleaning, amending the usage of the 400 point rule which treats any opponent who is below a player by more than 400 rating points as if they were only 400 rating points below (e.g. for a 2800 playing against a 2000, the 2000 would be treated as though they were a 2400 player).
The reason the 400 point rule exists was for high rated players who happened to face an extremely lower rated player on rarer occasions (e.g. in open tournaments). This was to guarantee getting 0.8 points (the amount for a 400 point difference) when winning a game, as opposed to the possibility of not getting any points for a win which would be tough. However multiple GMs decided to take advantage of this rule by deliberately playing opponents who were more than 400 points below them, this meant they would get far more points than they would normally for winning and they got a lot of undeserved points. So FIDE amended the rule on the 1st of October 2025, stating that the 400 point rule only applies to players below 2,650. Players above 2,650 will have the ratings calculated based on the real difference between ratings.
Conclusion
Elo is the backbone of international chess, allowing player strength to be measured accurately. It allows you to measure your progress in chess. It also allows comparisons of players. It's practical uses include allowing titles to be given, helping format Swiss tournament pairings and allowing tiebreaks to be calculated. The FIDE Rating spot also forms a qualification route to the Candidates Tournament. Having a cohesive international system helps compare ratings from around the globe and encourages development of chess talents.
Elo is something that we take for granted, without realizing that it provided a whole new world for us.
Arpad Elo and all those who helped develop and support the system are legends.
Sources> > > > Arpad Elo, The Rating of Chessplayers, Past and Present, Second Edition, (1986) (The fundamental book on Elo, by Arpad Elo)*
Mark Glickman & Albyn Jones, Rating the Chess Rating System, (1999)
Jeff Sonas, Rating Inflation - Its Causes and Possible Cures, (2009)
Kenneth Regan & Guy Haworth, Intrinsic Chess Ratings, (2011)
Jeff Sonas, Sonas Proposal: Repairing the FIDE Standard Elo rating system, (2023)
Jeff Sonas, Compression and Calculation Improvements: Supplemental Report, (2023)
FIDE Rating Regulations, (2024)
Kenneth Regan Interview, American Chess Magazine, (2024)
Vlad Ghita, FIDE Ratings Revisited, (2025)
*Wikipedia, Arpad Elo> > > > ---
Visit Blog Creators Hangout for more featured blogs.
You may also like
 thibault
How I started building Lichess
I get this question sometimes. How did you decide to make a chess server? The truth is, I didn't. RuyLopez1000
What Will Become of Humanity?
Take a front row seat as you watch your Chess Heroes get ripped apart by Engines. RuyLopez1000
Fischer vs Spassky: The Rivalry (Part 3: 1973-2008)
Explore one of the Greatest Rivalries in the History of Chess RuyLopez1000
The Brain Science of Chess
How does the brain play chess? TotalNoob69
The REAL value of chess pieces
... according to Stockfish ChessMonitor_Stats